





Heatmaps
Contents
Heatmaps shows you how users are interacting with elements on your website or app.
To start, ensure you enable the capturing of heatmap data in your project settings or with the capture_heatmaps key in the JavaScript Web SDK initialization config.
Heatmaps are only available for the JavaScript Web SDK and web frameworks built on it, like React and Next.js. They aren't available in our mobile SDKs.
Heatmap data is captured along with other events, so it doesn't contribute to your bill, but the clickmap requires autocapture and the scrollmap requires pageleave events. Heatmap data is retained for 90 days.
You can view heatmaps via the PostHog toolbar, or in the Heatmaps section in PostHog.
Viewing heatmaps using the toolbar
To view your heatmaps, click the heatmap icon on the toolbar.
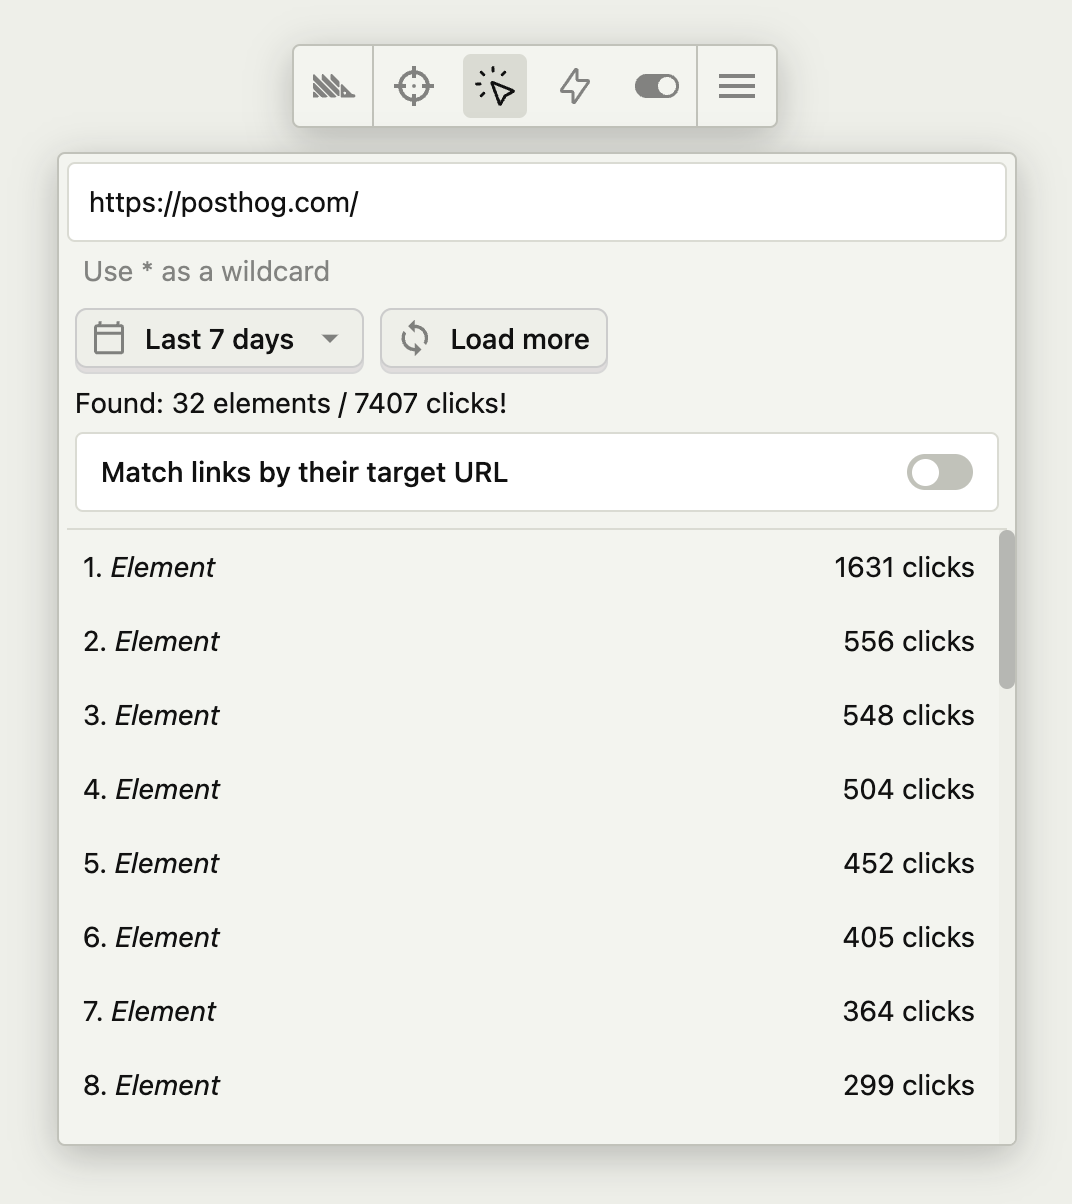
There are two independent overlays, and you can turn both on at the same time:
Heatmap: a color gradient drawn from the coordinates where people interacted. Pick which interaction you want from the Heatmap type dropdown – Clicks, Rageclicks, Dead clicks, Mouse moves, or Scroll depth. You see one type at a time, not all of them combined.
Clickmap: AKA the OG heatmap. It uses autocapture to label each clickable element on the page with its exact click count. Toggle it with Clickmaps (autocapture).
The distinction matters because the two are built from different data:
- The heatmap is coordinate-based. It records where the pointer was, so it shows activity anywhere on the page – including places where there's nothing to click. That makes it the right tool for spotting people trying to click a non-interactive element, or hovering somewhere you didn't expect.
- The clickmap is element-based. It matches autocapture events back to the actual elements on the page, so counts are exact and attached to a specific button or link, but it only covers elements autocapture could identify. Use it when you want to compare CTAs or measure link performance.
Which type to use
| Heatmap type | What it shows | Use it to |
|---|---|---|
| Clicks | Where clicks landed, by coordinate | See which areas of a page draw attention, including non-clickable ones |
| Rageclicks | Repeated clicks in the same spot | Find elements people expect to be interactive but aren't, or that feel unresponsive |
| Dead clicks | Clicks that produced no change on the page | Find broken or misleading affordances |
| Mouse moves | Where the pointer traveled | Read attention and scanning patterns on a page |
| Scroll depth | How far down the page people reached | Decide what content is above the fold and where people drop off |
| Clickmap (separate overlay) | Per-element click and rageclick counts | Compare specific buttons and links with exact numbers |
Viewing heatmaps in PostHog
You can also view heatmaps directly in PostHog, without installing the toolbar. This gives you the same heatmap types and the same configuration options (aggregation, viewport accuracy, color palette, fixed positioning) as the toolbar, and lets you save a heatmap to come back to.
For certain features like heatmaps, your Web Application Firewall (WAF) may be blocking PostHog's requests to your site. Add these IP addresses to your WAF allowlist or rules to let PostHog access your site. EU: US: Add IPs to Firewall/WAF allowlists (recommended)
3.75.65.221, 18.197.246.42, 3.120.223.25344.205.89.55, 52.4.194.122, 44.208.188.173
These are public, stable IPs used by PostHog services (e.g., Celery tasks for snapshots).
To view heatmaps in the app:
- Go to the Heatmaps section in PostHog
- Enter the address of the page you want to look at in the Page URL field
- Choose a background (see below)
- Optional: Use wildcard URL matching for the Heatmap data URL to combine data from similar pages
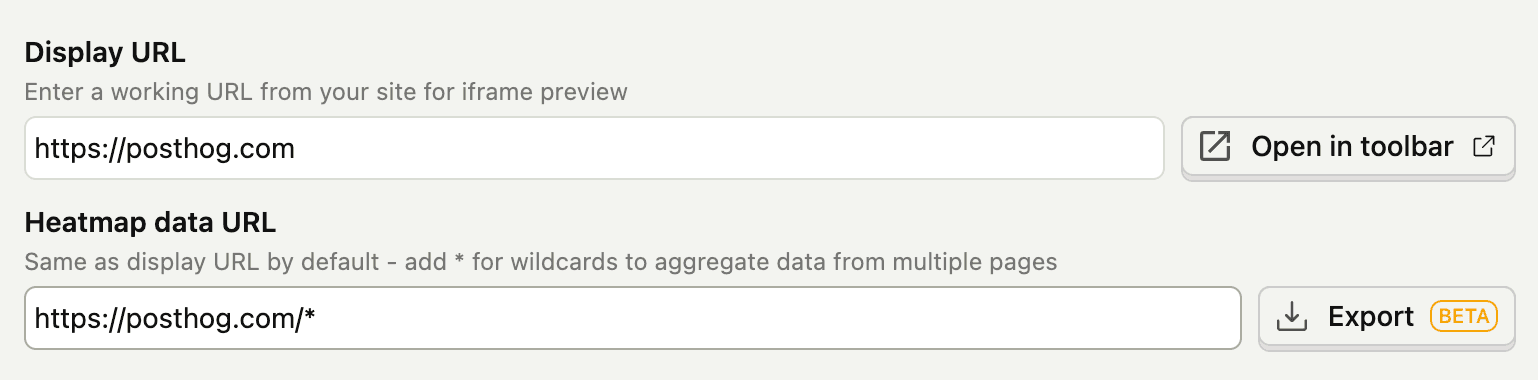
Note that Page URL and Heatmap data URL do different jobs. The page URL decides which page gets drawn underneath the overlay, while the heatmap data URL decides which pages the interaction data is queried from. Keeping them separate is what lets you render one representative product page and overlay the combined data from all of them.
Backgrounds
The toolbar draws the overlay straight onto the live page you're browsing, so it needs no background. In the app, PostHog has no page to draw on, so it has to reproduce one for you. That reproduction is the background: the picture of your page that sits underneath the colored overlay.
There are three ways to produce it, and you choose between them – it isn't automatic:
- Screenshot (default): PostHog loads your page in a headless browser and captures a full-page image at each viewport width you asked for, then draws the overlay on top. This is the most reliable option because it doesn't depend on your site allowing itself to be embedded. Generation is asynchronous, so a new heatmap may show as processing for a moment.
- Iframe: PostHog loads your live site in an
<iframe>and draws the overlay over it. The page stays interactive and always reflects the current version of your site, but it only works if your site permits framing by PostHog and the URL is in your list of authorized URLs. See troubleshooting if you get a blank page. - Session recording snapshot: PostHog uses the DOM snapshot from a session replay as the background. Pick this when the page is behind a login, since a recording captures the signed-in state that a headless screenshot and an iframe can't reach. In the creation flow, answer Yes, this page requires login to use it. Recording-backed heatmaps are temporary and aren't added to your saved heatmaps.
You can switch between screenshot and iframe at any time with the Capture method setting, and regenerate a screenshot if the page has changed since it was captured.
You can also start from the other direction and generate a heatmap from a specific recording in session replay by clicking the View heatmap button above the recording.
Recording-mode clickmap
When viewing heatmaps using a session recording as the source, you can enable a clickmap overlay that shows element-anchored click counts directly on the recording snapshot. Unlike coordinate-based heatmaps, which plot clicks at x/y positions that can drift onto non-clickable areas, the recording-mode clickmap attaches counts to actual DOM elements in the snapshot for more accurate results.
Toggle Show clickmap in the heatmap settings panel to enable or disable it. The overlay draws labelled boxes on each element with its click count, and updates automatically as you change date ranges or filters.
Heatmaps
The heatmap shows where on the page users are clicking, dead clicking, rageclicking, or moving their mouse. Unlike the clickmap, the user doesn't need to click on a clickable element, so you can see where users are trying to click.
There are multiple options to configure your heatmap.

Aggregation
The heatmap can show a count of events, or of unique users. The default is to show the count of events.
The unique users count is based on the user's distinct ID, so if a user is using multiple devices or browsers, they are counted as multiple users. This is so that the heatmap can be much faster to load.
The clickmap can be used when you want exact counts.
Viewport accuracy
You can set a tolerance for the viewport accuracy.
This enables you to view the heatmap on a different sized screen from your users. You can reduce viewport accuracy to include events from different sized screens.
This means that you get more data but the position might not be as accurate.

Color palette
The default palette for the heatmap is a gradient from red to green. This won't be visible for all users or against all site color themes.
You can change the color palette to a different gradient or to a single color.
Fixed positioning
Some clicks are on elements that don't move when the page scrolls.
Our JavaScript SDK attempts to detect fixed elements, such as headers or modals, and show those heatmap areas, ignoring the scroll value.
You can change fixed positioning so these clicks move when scrolled or hide them entirely.
Click to view events
When viewing a heatmap, you can click on any area with activity to view the individual events at that location. This opens a modal showing:
- Total count of events at that coordinate
- A table of events with timestamp, type, user ID, and a link to view the associated session recording
This enables you to drill down from aggregate heatmap data into specific user interactions, helping you understand exactly what's happening at high-activity areas.
Note: The events shown are at the exact coordinate you clicked. Since heatmaps use interpolation for visual display, the count in the events modal may differ slightly from the hover tooltip.
Scrollmaps
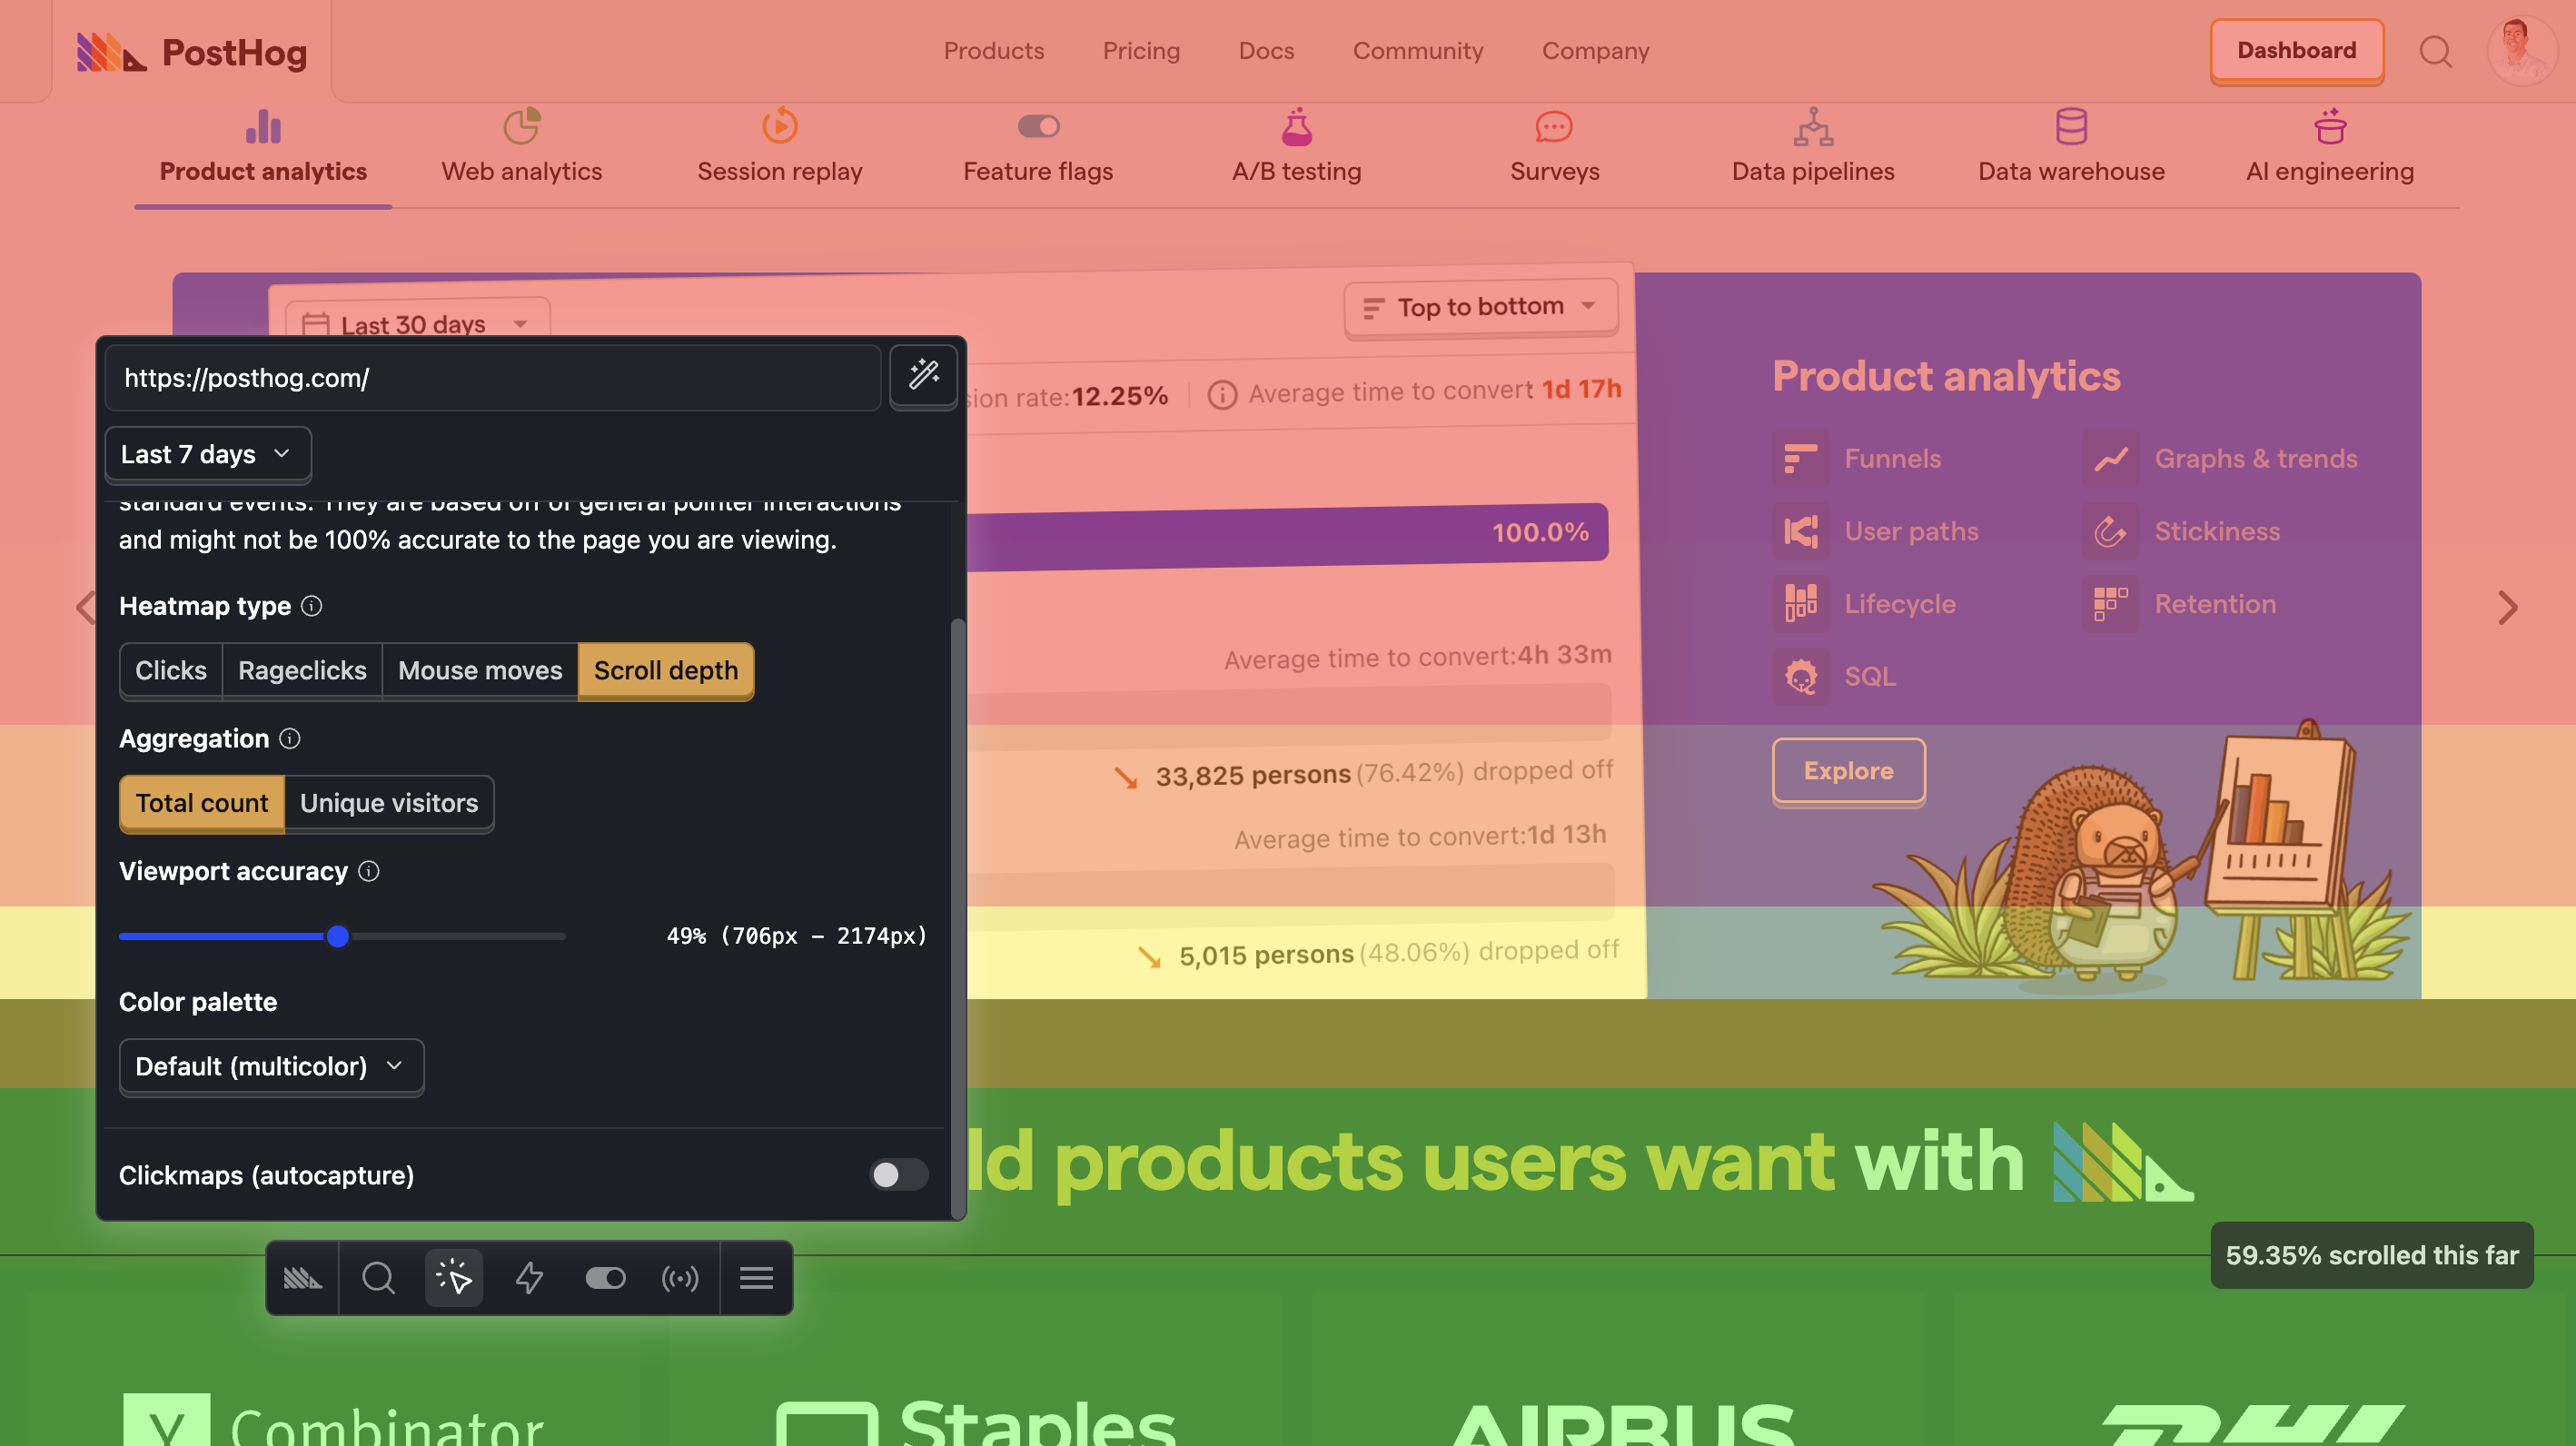
The scrollmap is the Scroll depth heatmap type. Instead of a gradient, it draws horizontal bands down the page showing the percentage of people who scrolled at least that far, so you can see where your content stops being seen.
It's the one type that isn't built from pointer coordinates. It uses data from pageview and pageleave events, so it needs pageleave events to be captured and scroll properties left enabled in the SDK. If either is missing, the toolbar warns you when you select the type.
Clickmaps
With the clickmap, clickable elements on your website will have a red overlay with numbers on them.
Here's an example of our website with the heatmap enabled:
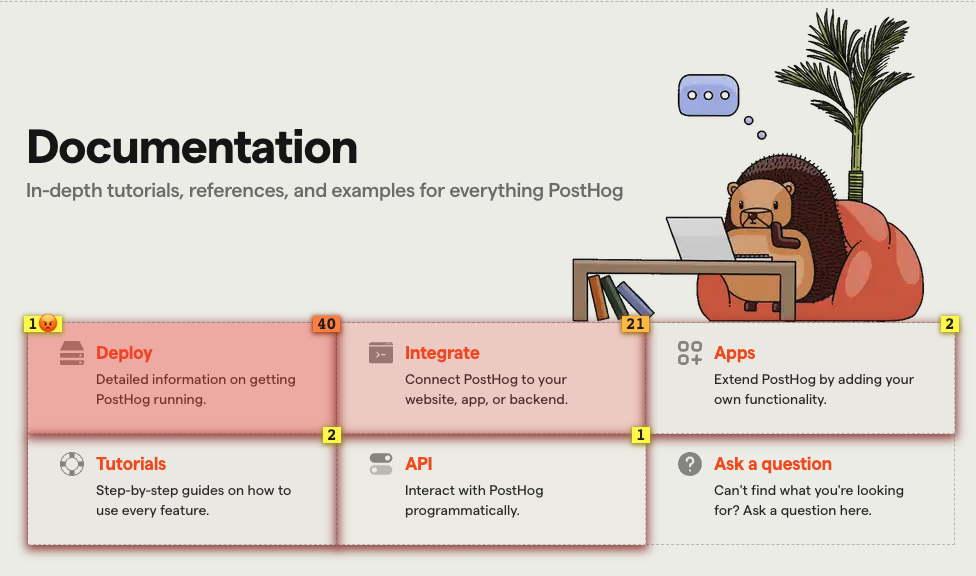
Each number in the top right box of each element represents the total number of clicks in the last 7 days.
The number in the top left of the element is the number of rageclicks.
A rageclick is collected when a user clicks three times in roughly the same spot (within 30 pixels) inside a one-second window. See rage clicks autocapture for the full definition and how to configure it.
Numbers at the bottom or top of the screen indicate that there are more elements that are not currently being displayed on the page.
How to create an action from the clickmap
With the clickmap enabled, click on any element. This opens a menu where you can then create an action from it.
Loading more data
If you have many events, you may need to load more data to see everything on the clickmap.
To do this, click on the load more button in the clickmap menu.

Matching links by their target URL
By default, the toolbar matches clicks using the elements on the page, and not by their target URLs (i.e., href attribute).
This is fine for most scenarios where you have static elements with the same target URL.
However, this may not be ideal for dynamic lists that have different target URLs depending on the underlying data.
For example, consider the following screenshot of a list of elements for "Newly seen persons" from the PostHog app:
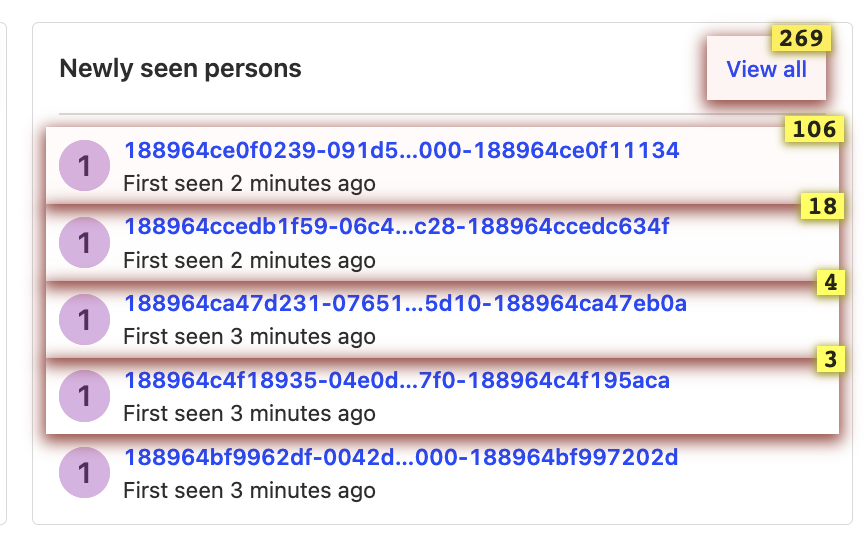
The "Newly seen persons" shows the most recent list of persons using the app and is constantly being updated as new users use the app.
In the clickmap, we see 106 clicks for the first element.
This doesn't mean that the this specific person in the list received 106 clicks, but rather that the first element in the list received 106 clicks, regardless of which person was shown.
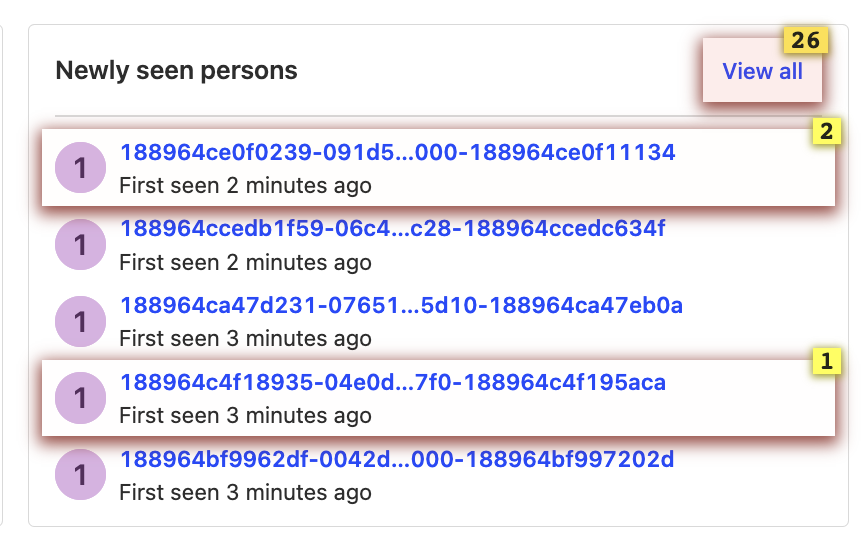
If we were interested in the number of clicks each specific person in the list received (regardless of which position they appeared in), then we can turn on "Match links by their target URL" in the clickmap menu.
This matches clicks to elements based on their target URLs.

For example, if we enable this for our previous example, we see much fewer clicks.
This is because we are now seeing clicks on each specific user:
Combining maps from similar pages using wildcards
If you have similar pages that have dynamic content based on an identifier in the URL (e.g., product pages on an ecommerce site), you can combine their heatmap data using wildcards * in the heatmap menu.
For example, if the product pages on an ecommerce site use a URL format of https://yourwebsite.com/products/product-id, you can use the wildcard URL https://yourwebsite.com/products/* to display a combined heatmap from all the product pages.

Troubleshooting
Heatmap is captured, but site is not showing
If you're viewing heatmaps in-app with the Iframe capture method and the heatmap appears over a blank page, your site is blocking it from being displayed in an <iframe>.
Sites block framing in one of two ways, and the fix differs:
Content-Security-Policy – add PostHog to your frame-ancestors directive:
| Region | Content Security Policy |
|---|---|
| US | Content-Security-Policy: frame-ancestors 'self' https://us.posthog.com; |
| EU | Content-Security-Policy: frame-ancestors 'self' https://eu.posthog.com; |
X-Frame-Options – this header can't be relaxed for a specific origin, so there's no header you can add to allow PostHog. Either remove it in favor of a Content-Security-Policy with frame-ancestors, or use the Screenshot background instead, which doesn't rely on framing at all.
PostHog checks these headers before loading the iframe and tells you which one is blocking, with a one-click option to switch to a screenshot.
Screenshot or iframe heatmap fails to load
If screenshot generation fails or your site blocks iframe embedding (due to auth walls, bot protection, or Content-Security-Policy restrictions), PostHog automatically searches for recent session recordings that visited the same page and suggests up to three of them.
Click any suggested recording to open the session player, then click View heatmap to view heatmap data overlaid on the recording snapshot. This provides an alternative path to heatmap data when traditional rendering methods don't work.